18 Sensors of Nutrients and Cellular Energy
- Understand how nutrients are detected and how this is used to regulate metabolism
- Understand how the human body can maintain energy and nutrient levels under a variety of conditions and challenges.
- Different sensing mechanisms for glucose, fatty acids and amino acids
- ATP/ADP/AMP as an indicator of cellular energy
- Regulation of appetite by the brain
- Ketogenesis as an adaptation to long-term starvation
In this book we are exploring metabolic pathways involved in the degradation and synthesis of nutrients. We have explored how these pathways are regulated by hormones and metabolic intermediates, but we have not explored how our body decides whether to store nutrients or to break them down. How do we sense nutrient limitation? How do we sense nutrient overflow?
How do we sense glucose?
Carbohydrates are not only a major food group, but the carbohydrate glucose is also our major internal nutrient for all tissues. As you saw in earlier chapters, glucose is held around 4-5 mM in blood plasma. If glucose becomes higher after a meal it is stored, if it gets lower the liver produces glucose. You saw in chapter 8 and chapter 16 that insulin levels immediately follow nutrient intake. Glucose is the most important physiological secretagogue for insulin, which is produced by β-cells located in the islets of the pancreas (see Fig. 3 for a depiction of islets). The β-cell converts relatively small fluctuations of blood glucose concentration (typically from 4.5 to 8 mM in man) into large changes in insulin secretion within minutes by a sophisticated mechanism (Fig. 1).
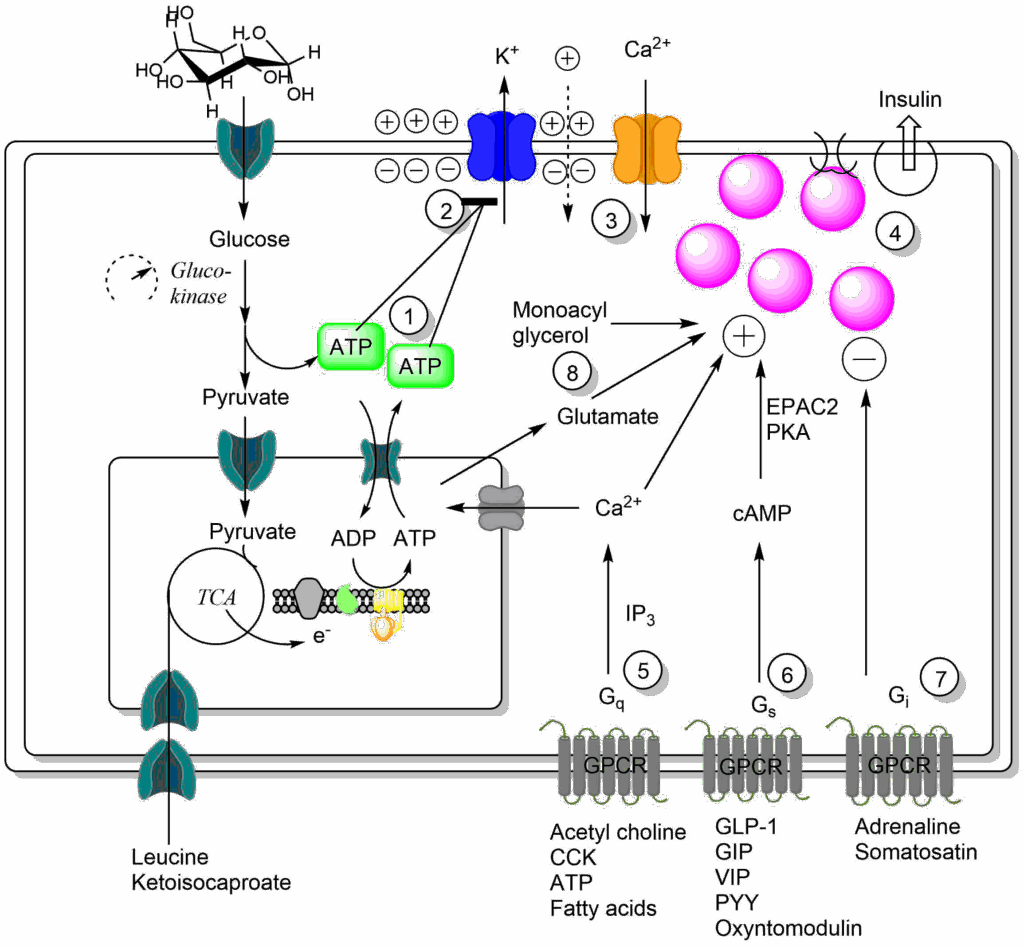
Glucose metabolism is tightly regulated in beta-cells and glucose is fully oxidised to CO2 and H2O even at high concentration. Due to the expression of glucokinase instead of hexokinase, the rate of glucose metabolism is proportional to blood glucose concentration (see chapter 7). Both, glycolysis and mitochondrial respiration produce ATP ((1) in Fig. 1), and importantly ATP production is proportional to plasma glucose concentration (glucokinase has the role of an odometer). When ATP rises it closes ATP-gated potassium channels (2). Normally, potassium channels maintain the membrane potential by releasing small amounts of potassium ions from the cell, which builds-up an inside-negative electrical charge. As long as potassium channels remain open, the membrane potential remains polarised and very little insulin is released. When the potassium channels are closed, the membrane potential collapses because of positive charges leaking into the cell. The collapse of the membrane potential opens voltage-gated calcium channels (3), generating a high local Ca2+ concentration. This causes the fusion of insulin-containing vesicles (magenta, white when empty) with the plasma membrane (4). Thus, insulin release is indirectly regulated by the energy provided by glucose. This is called glucose-induced insulin secretion (GSIS). The beta-cell, however, does more than just monitoring blood glucose. Neurotransmitters, such as acetylcholine (5) positively modulate insulin secretion. Sweet taste experienced before digestion can already prepare the beta-cell for insulin release. Moreover, the gut also senses nutrients and produces hormones such as GLP-1 (glucagon-like peptide 1) and GIP (glucose-dependent insulinotropic peptide), which also enhance insulin secretion (6). Adrenaline, by contrast, blocks insulin release. This prevents futile cycling during exercise, particularly when a meal was eaten before the exercise (7). These modulatory effects are mediated by G-protein coupled receptors (GPCR), which you have encountered in chapter 12 and chapter 8. Fat and protein also modulate beta-cell activity through a cycle of beta-oxidation and resynthesis of fatty acids and through mitochondrial oxidation of amino acids and formation of glutamate (8). The beta-cell thus integrates a variety of nutrient related inputs, with glucose being the dominant trigger for insulin release.
How do we sense fat?
In contrast to glucose, which we sense almost instantly and produce responses quickly, our responses to fat are much slower and more sustained. A ketogenic diet shows effects after a couple of hours or days. Consistently, sensing of fatty acids occurs largely at the level of gene regulation. A detailed description of gene regulation is outside the scope of this book, but a short summary of chromatin remodeling, which is the relevant process in this case, is explained in the video below.
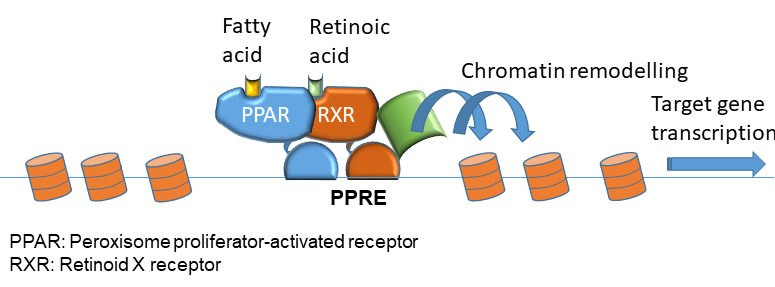
Transcription factors of the PPAR (Peroxisome proliferator activated receptors) family bind to intragenic and promoter regions of many genes involved in lipid metabolism. The binding site is known as a PPAR response (PPRE) element. There are three members of the PPAR family (alpha, gamma and delta). DNA binding requires heterodimer formation with retinoid x receptors (RXR), which are activated by the vitamin A metabolite retinoic acid (Fig. 2). Activation appears to involve remodeling of the chromatin around the PPAR binding site, which allows access to other transcription factors and activators.
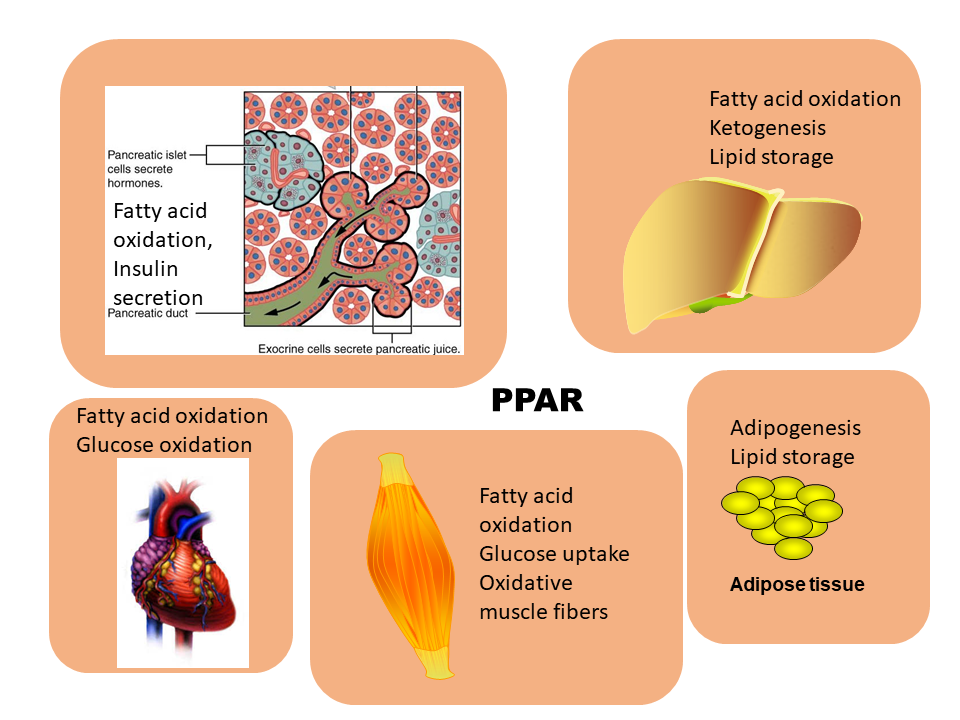
This makes sense because PPARs mainly act on tissues with active lipid metabolism (Fig. 3). Thus, fat metabolising genes are principally active, but transcription can be enhanced through chromatin remodelling. In all relevant tissues fatty acid oxidation is increased (Fig. 3). In addition, ketogenesis is induced in the liver. Storage of fat is also enhanced to cope with the increased amount of fat. This explains the feed-forward effect of a ketogenic diet (chapter 11). Eating a diet rich in fat will improve the capacity to oxidise fat and convert them into ketone bodies.
An important sensor that regulates fatty acid metabolism is the triacylglycerol cycle in adipose tissue. During fasting fatty acids are released by breaking down triacylglycerol in adipose tissue. However, a significant fraction of the fatty acids is used to resynthesize fat. This suggests that mobilization of fat is poorly regulated producing too much fatty acids, which are then recycled into triacylglycerol. Thus, sensing of fatty acids is likely to occur by fatty-acyl-CoA synthetases that become faster as the level of fatty acids increase inside the cell thereby reducing the net release. Another regulator of this pathway is the synthesis of glycerol starting from pyruvate. In analogy to gluconeogenesis it is called glyceroneogenesis and uses some of the same enzymes (Fig. 4).
Another important element of fat sensing is adipose tissue itself. For many years adipose tissue was considered a passive site of fat storage that responds to hormones, such as insulin, glucagon and adrenaline. More recently, it has been recognised that adipose tissue is an active endocrine organ producing hormones (adipokines). Leptin is an adipokine that is released in amounts that are proportional to the fat mass. Leptin receptors are found in nutrient sensing areas of the brain. The brain has neurons that respond to appetite-stimulating (orexigenic) signals and appetite-reducing (anorexigenic) signals (Fig. 5). Leptin signals to the brain that sufficient energy stores are available and that food intake should be reduced.
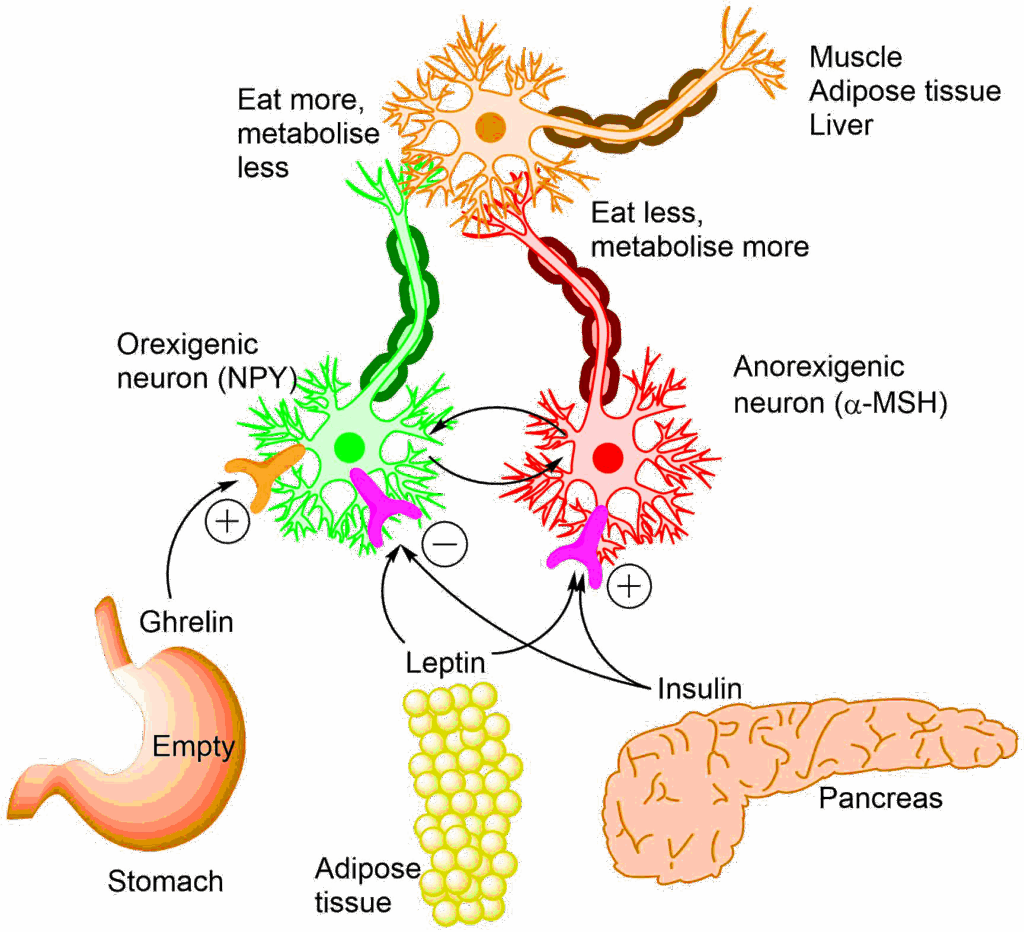
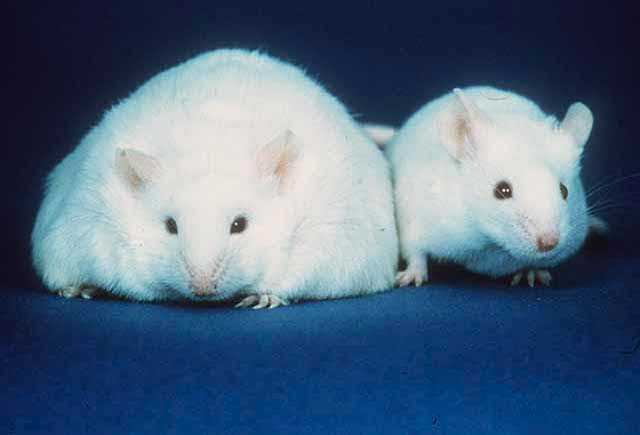
Insulin also feeds back to the brain that sufficient nutrients are arriving and food intake can cease. An empty stomach, by contrast, triggers release of ghrelin, which signals to the brain to eat more. Neural control of eating behaviour is an important regulator of body weight. Mice that cannot produce leptin, or have a mutated leptin receptor are highly obese (Fig. 6). Genome sequencing of highly obese people has revealed a number of mutations of key genes regulating feeding behaviour in the brain.
How do we sense protein?
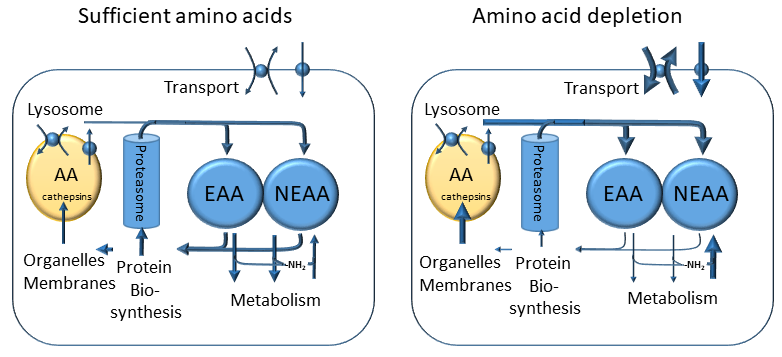
Protein provides only a small fraction of the total energy intake per day, typically 10-15%. However, protein is broken down into amino acids, which are important building blocks for protein biosynthesis and for amino acid related metabolites. In chapter 15 you learned that protein is efficiently recycled and as a result only small amounts of protein intake are required to replace unavoidable losses. Recycling of protein also occurs at the cellular level (Fig. 7). Proteins have a limited half-life, which can vary from hours to days. Recycling occurs through lysosomes and the proteasome. Lysosomes degrade bulk amounts of membrane and protein, while the proteasome is a protease designed for the degradation of individual proteins that have been tagged specifically for degradation.
Watch the video below to see the proteasome in action.
This generates a cellular pool of amino acids, which is in equilibrium with the pool of amino acids in blood plasma and is used for synthesising new proteins. When there is shortage of amino acids, transport of amino acids into the cell is increased as well as synthesis of non-essential amino acids. Moreover, lysosomal degradation of cellular protein is increased, a process called autophagy. These processes are regulated by amino acid sensors, which are mainly located within cells, monitoring certain amino acids, in particular leucine and arginine and amino acyl-tRNA content. There are two main sensors, namely mammalian target of rapamycin complex 1 (mTORC1) and general control non-derepressable 2 (GCN2). The mTORC1 complex has many associated proteins. When there are sufficient amino acids in the cytosol, the complex is found on the surface of lysosomes, where it senses cytosolic and lysosomal arginine and leucine levels. The mTORC1 protein is a protein kinase that phosphorylates components of the translation initiation machinery, thereby permitting translation. When leucine and arginine levels are low, protein translation is halted and recycling of protein via lysosomal and proteasomal degradation is switched on (Fig. 7).
The GCN2 protein is a protein kinase that binds to uncharged tRNA molecules. Uncharged tRNA molecules are generated each time an amino-acyl-tRNA is used to extend a nascent peptide chain at the ribosome. However, these are quickly recharged. Delay of recharging increases the pool of uncharged tRNAs, which bind to GCN2. GCN2, subsequently phosphorylates components of the protein translation machinery, reducing overall protein translation. At the same it increases translation of specific genes involved amino acid uptake and synthesis.
How do we sense energy?
In this book we have focused on energy generation by macro-nutrients. You saw that in the end breakdown of metabolites is used to generate ATP and NADH. On many occasions we have come across the concept of metabolic coupling (Fig. 8).
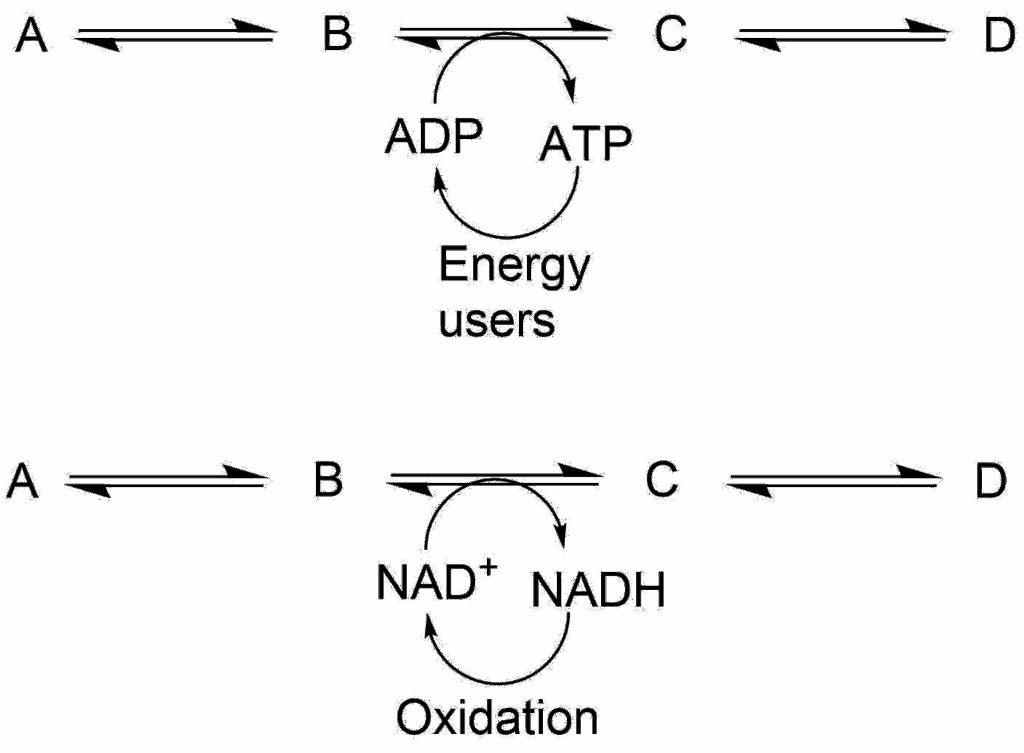
Because we have only small amounts of ATP and NADH in comparison to the flow through metabolic pathways, a depletion of ADP and/or NAD+, will quickly halt the flow through metabolic pathways that generate energy. An ATP generating pathway, such as glycolysis is thus a sensor for the ATP/ADP ratio within the cell. In fact, glycolysis immediately increases its velocity when ATP is consumed, for example during exercise. The speed of the TCA cycle is closely coupled to the recycling of NADH into NAD+ by the respiratory chain. If NADH is not recycled the cycle will slow down. The respiratory chain in turn is closely coupled to the demand for ATP. If ATP is not used, ATP-synthase will not dissipate the proton gradient which is generated by the electron transport chain. This will slow down the electron transport chain because of the back pressure generated by the unused proton gradient. (See also e4 Exercise Oxidative Phosphorylation).

Metabolic coupling is a major short-term regulator of individual pathways, but we have often seen regulatory networks that initiate larger metabolic programs.
AMP-activated kinase (AMPK) is the major sensor of energy depletion in our cells. AMP is a sensitive indicator of energy depletion, because of myokinase activity in cells, which catalyses the reaction 2 ADP → ATP+AMP. Cellular AMP levels are usually very low, only increasing during strong energy demand. Thus the AMP signal has a better signal to noise ratio than ATP or ADP. The cellular actions of AMPK are straightforward to understand. Energy consuming anabolic processes are switched off, while energy generating catabolic pathways are switched on (Fig. 9).
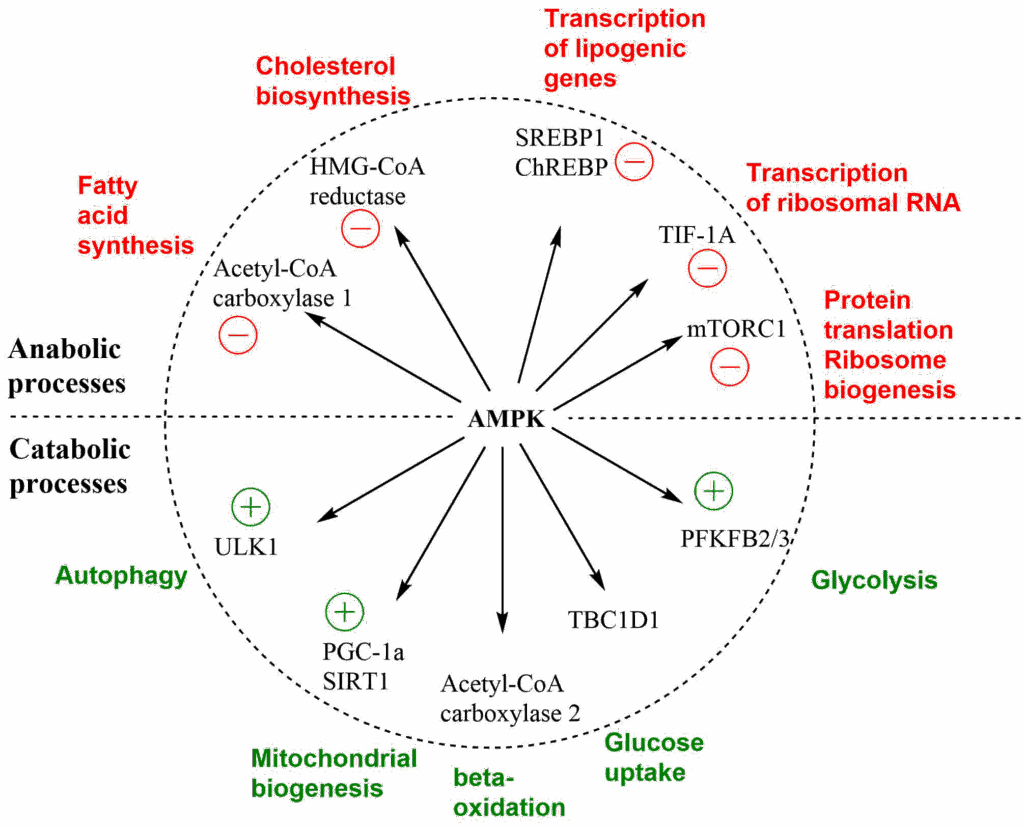
Metformin is the most widely prescribed drug for the treatment of type 2 diabetes. Metformin is a mild inhibitor of complex I of the respiratory chain. This causes energy depletion and activation of AMPK. Metformin is likely to have more targets, and the precise mechanism of action is still debated. A recent publication suggests that it inhibits a proton-pumping ATPase in lysosomes, which activates AMPK. Due to the activation of AMPK, anabolic processes like fatty acid biosynthesis and cholesterol biosynthesis are reduced, while catabolic processes, like beta-oxidation and glycolysis are increased. This will reduce blood glucose levels and reduce lipotoxicity. Remarkably, Metformin was discovered well before any molecular understanding of its mechanism.
There are also sensors for NAD+. These are called sirtuins. It is thought that SIRT1 can be activated by AMPK, as well (Fig. 9). Thus NAD+ and AMP act as indicators of the cellular energy status. SIRT1 deacetylates modified lysine residues in proteins (Fig. 10). Protein acetylation was first discovered in histones, where it neutralizes the positive charge associated with the sidechain of lysine (see video above on Chromatin remodeling).
However, lysine acetylation is found in many more proteins. This results in a similar effect as allosteric regulation or protein phosphorylation. In particular SIRT1 deacetylates and activates transcription factor PGC1 alpha together with AMPK, which initiates a program of mitochondrial biogenesis. We have seen that mitochondrial ageing may underlie organismic ageing and the induction of mitochondrial biogenesis by SIRT1 has raised hope that SIRT1 activators, such as resveratrol and nicotinamide mononucleotide (NMN), may be used as age-retarding supplements.
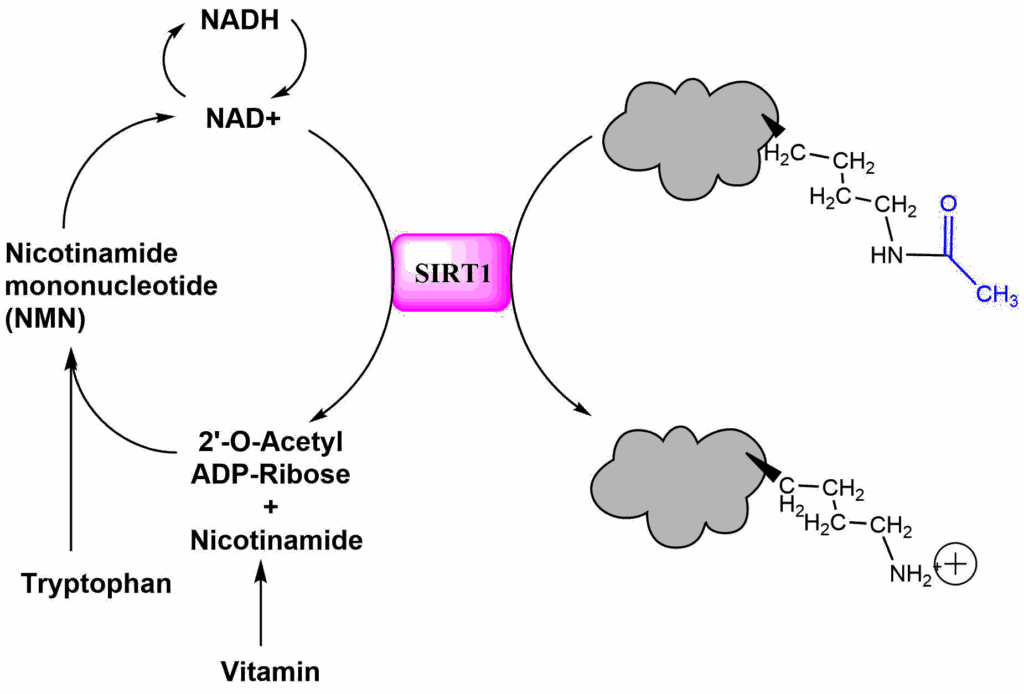
In the reaction NAD+ acts as the acceptor of an acetyl-moiety, which results in splitting the molecule to form Nicotinamide and 2′-O-Acetyl-ADP-Ribose. NAD+ can be reformed via Nicotinamide-mononucleotide (NMN). Net synthesis of NAD+ can also occur from tryptophan.
Supplementation with Nicotinamide mononucleotide (NMN) can be used to boost NAD concentrations and to improve metabolic health through activation of sirtuins. A small clinical trial has shown some improvement of muscle insulin sensitivity in a group of obese prediabetic postmenopausal women. The mechanism of action appears to involve pathways other than sirtuin activation.
BY MIHOKO YOSHINO, et al. SCIENCE11 JUN 2021 : 1224-1229
Several mechanisms that activate AMPK, sirtuins and autophagy have been shown to extend lifespan in rodents. This includes Metformin (activating AMPK), low-dose-Rapamycin (inhibiting mTORC1, thereby inducing autophagy), NMN and Resveratrol (activating sirtuins), and spermidine (activating autophagy).
How do we prevent energy shortage?
Our body has developed a variety of strategies to overcome energy shortage. We have seen that myokinase (adenylate kinase) converts
2ADP ↔ ATP + AMP. This has two effects, first it replenishes some ATP and secondly it activates AMP kinase, which switches on energy generating metabolic pathways and switches off anabolic pathways. A longer lasting reservoir of ATP equivalents is phosphocreatine (Fig. 11).
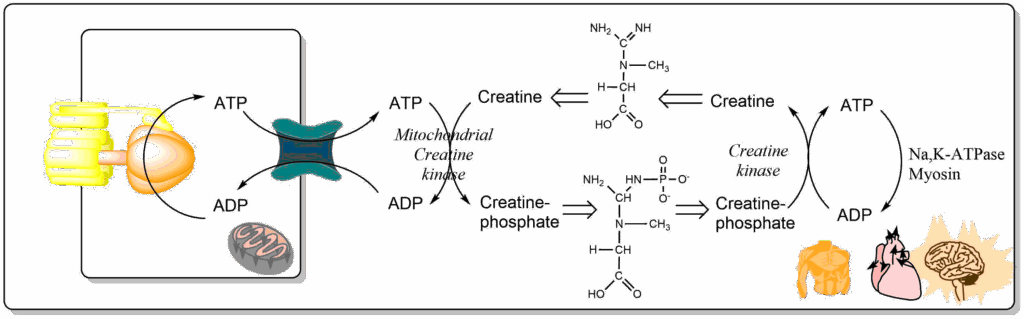
In muscle creatine phosphate is generated from ATP produced inside mitochondria by transferring a phosphate-group to creatine. The creatine/phosphocreatine battery becomes charged. During a sprint of 10 sec most of the ATP usage is buffered by recharging the ATP/ADP pool by the creatine/phosphocreatine battery (Fig. 12) using a creatine kinase pool close to the muscle fibers. To do this, the pool of phosphocreatine is at least 5 times bigger than the ATP pool in muscles.
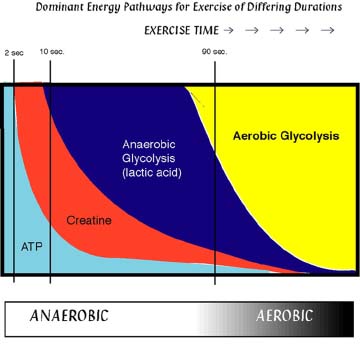
Figure 12 shows the fraction of energy generation by different pathways against duration of exercise. ATP lasts only a few seconds and is then replenished by phosphocreatine for tens of seconds. Anaerobic glycolysis is used for times of up to 90 sec (400-800 m run). Anything longer requires oxygen flow that is sufficient to restore ATP by mitochondrial respiration.
The table below shows data in a different way and confirms the immediate use of phosphocreatine and glycogen during high intensity exercise. Glycogen is largely converted into lactate. ATP levels are stabilized through these processes.
|
Exercise
|
Glycogen content (%)
|
Phosphocreatine (umol/g)
|
ATP (umol/g)
|
Lactate (umol/g)
|
|---|---|---|---|---|
|
Pre-sprint
|
100
|
21
|
6.8
|
1.0
|
|
Post 6s sprint
|
87
|
5.0
|
5.0
|
21
|
|
Pre-exercise
|
100
|
20
|
6.0
|
5.0
|
|
Post strength exercise
|
70
|
12
|
5.0
|
20
|
Glycogen and Phosphocreatine allow muscle to generate ATP very quickly, but there is not enough capacity to shuttle NADH into mitochondria. As a result, a large amount of lactate is produced, which needs to be removed during recovery. Some of the lactate inside muscle is used to resynthesize glycogen, but the majority is transferred to the liver where it is used to generate glucose, which can be used again by muscle (this is called the Cori-cycle) or other tissues. These processes remove lactate after exercise (Fig. 13).
Lactate concentration after exercise
3 minute exercise
No Data Found
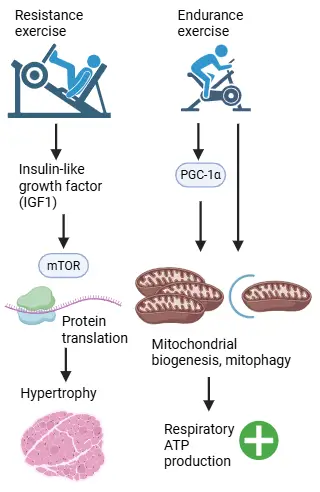
Muscle mass and respiratory capacity can be increased through training. Resistance exercise results in the production of insulin-like growth factor, which increases the amount of protein in muscle cells via mTOR. Endurance exercise results in the production of transcription factor PGC-1α, which stimulates mitochondrial biogenesis and recycling of mitochondria. This in turn increases respiratory capacity (Fig. 14)
The energy reserves discussed above are examples of short-term energy provision. Remarkably, humans can survive for many weeks without food if water and minerals are provided. Fig. 15 shows that plasma levels of key energy metabolites are maintained or even increased over several weeks. Small animals with a high metabolic turnover and regular food availability, by contrast, can only survive for 2 days without food.
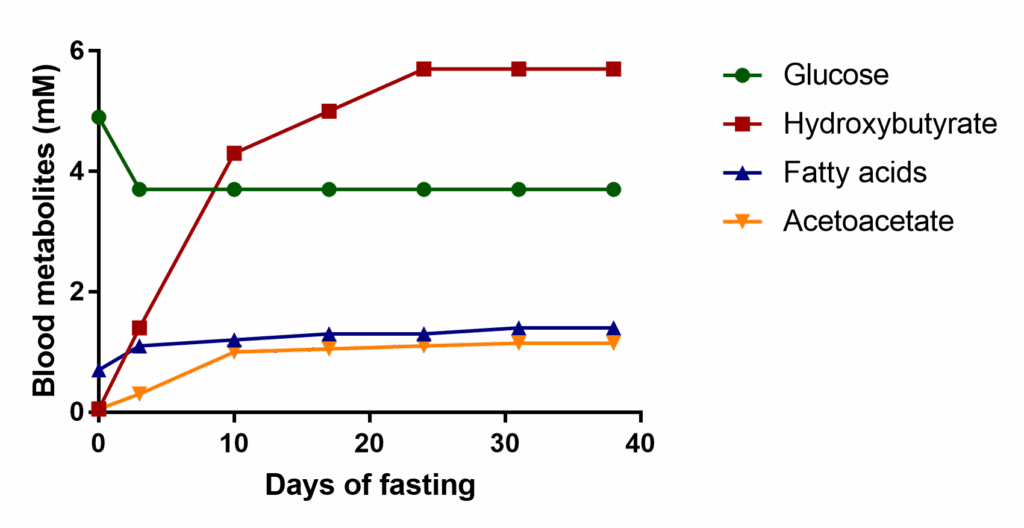
One of the challenges of the human body is the high glucose demand by the brain and cells that can only use glucose such as erythrocytes. Even after many weeks of fasting, blood glucose levels remain at 3.7 mM and do not drop further as shown in figure 15. This glucose cannot be derived from glycogen, because glycogen would be depleted after a few hours (Table below). Since there are no other stores for glucose, the glucose is made entirely by gluconeogenesis from amino acids, glycerol and lactate. Fat forms the largest fuel store and is used extensively (Table below). However, not all tissues can use fatty acids very well, particularly the brain. During extended starvation ketogenesis is induced and liver converts fatty acids into the ketone bodies beta-hydroxybutyrate and acetoacetate (Fig. 15 and chapter 10). The concentration of these metabolites rises very steeply in the first days of fasting. At the same time the blood-brain barrier starts to express transporters for ketone bodies.
| Fuel | Weight | Resting | Walking | Running |
|---|---|---|---|---|
|
Blood/Tissue glucose |
20 g |
40 min |
15 min |
4 min |
|
Liver glycogen |
80 g |
3.5h |
70 min |
18 min |
|
Muscle Glycogen |
350 g |
14h |
5h |
70 min |
|
Fat |
9-15 kg |
34 days |
11 days |
3 days |
|
Body protein |
6 kg |
15 days |
5 days |
1.7 days |
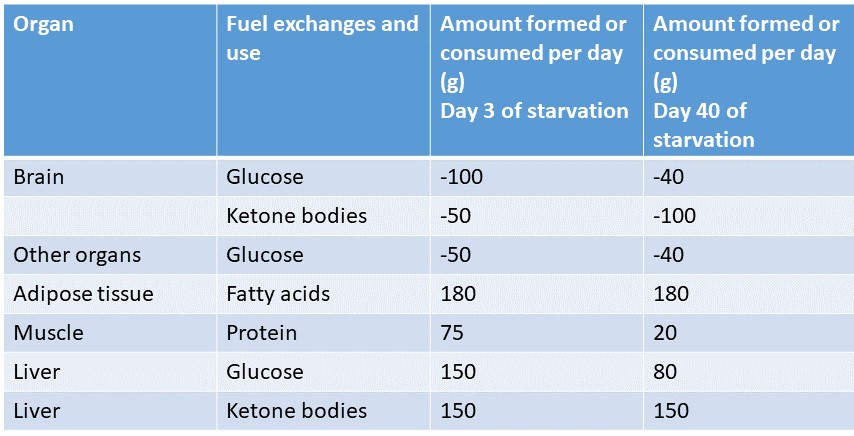
The switch from glucose to ketone bodies stretches the reserves for the generation of glucose by gluconeogenesis even further. An overview of fuel metabolism after 5-6 weeks of fasting is shown in Fig. 16.
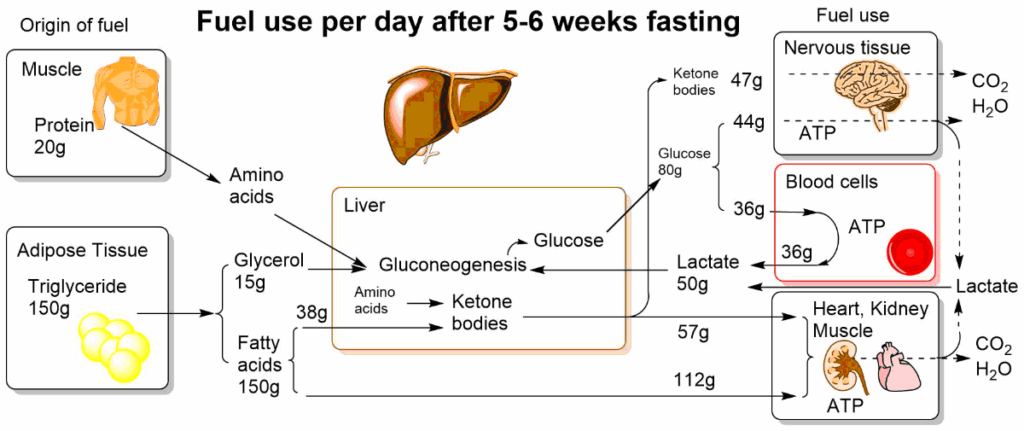
The switch by the glucose-hungry brain to ketone bodies reduces the burden of body protein to sacrifice protein for the production of glucose. Instead of using 75g of protein/day (chapter 16, Fig. 4), we reduce usage to 20g per day. The glucose-sparing effect of ketone bodies and fatty acids is mediated through allosteric regulation of energy metabolism (Fig. 17).
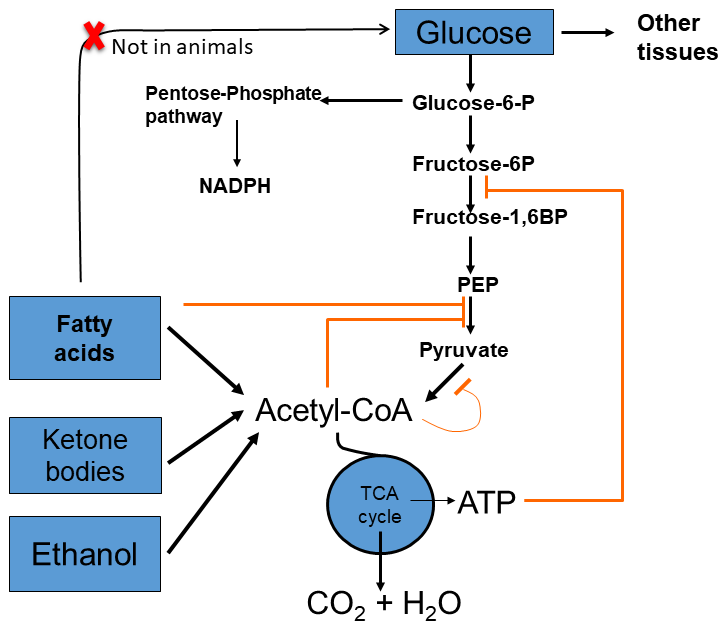
Ketone bodies generate acetyl-CoA and NADH within very few enzymatic steps. They are excellent fuels for mitochondria. Acetyl-CoA is an allosteric inhibitor of pyruvate kinase and an allosteric activator of pyruvate dehydrogenase kinase (which inhibits pyruvate dehydrogenase). Moreover, the NADH generates ATP through the respiratory chain, which is a strong allosteric inhibitor of phosphofructokinase. Thus, elevated blood levels of ketone bodies will exert a glucose-sparing effect, switching most tissues to the use of fatty acids and ketone bodies in preference to glucose. The inhibition of pyruvate dehydrogenase also explains the generation of lactate by tissues during advanced fasting (Fig. 17). Altogether, this prevents glucose levels falling too low to sustain brain function. Although fatty acids cannot be converted into glucose in animals, glycerol and amino acids provide large enough stores under these circumstances.
- Question
- Answer
As the name suggests, a ketogenic diet induces the formation of ketone bodies. Why is this the case?
Ketogenesis is regulated by transcription factors of the PPAR family, which are activated by binding of fatty acids. Thus, a diet rich in fat and low in carbohydrates induces the metabolism of fatty acids. In addition, lipolysis is switched on when blood glucose is low.
- Question
- Answer
What are the two main mechanisms by which energy levels are measured inside cells?
1) The ATP/ADP ratio. Mitochondrial and glycolytic production of ATP is controlled by metabolic coupling. If ADP is not regenerated ATP producing pathways will slow down. 2) AMP kinase. High energy demand increases the levels of AMP. This activates AMP kinase, which reduces the activity of anabolic pathways and increases the activity of catabolic pathways.
- Question
- Answer
Explain how creatine is used to buffer ATP in muscle?
During rest, ATP generated inside mitochondria is used to transfer phosphorylgroups onto creatine forming phosphocreatine. During exercise ATP is depleted but ADP can be re-phosphorylated by phosphocreatine to form ATP. The amount of phosphocreatine is much larger than the amount of ATP in muscle.
- Question
- Answer
Compare the amount of ATP that can be synthesized from glycogen and phosphocreatine in muscle. The amount of phosphocreatine is about 20 mMol/kg. The amount of glycogen is 12.5g/kg. How much ATP can be produced from each source?
There are 20 mMol of phosphocreatine in a kg of muscle yielding 20 mMol of ATP.
There are 12.5g glycogen in a kg of muscle. The molecular weight of glucosyl-unit in glycogen is 162g/mol. This equals 77 mmol/kg. If ATP is produced only though glycolysis this would yield 154 mmol of ATP, while complete oxidation would yield 77 x 32 =2464 mmol ATP/kg muscle.
- Question
- Answer
Explain the glucose-sparing effect during starvation as shown in the table.
Long-term starvation induces ketogenesis. The increase of ketone bodies in blood generates acetyl-CoA in the target tissues, which inhibits pyruvate kinase and thus glycolysis. At the same time brain increases the permeability of the blood-brain barrier to ketone bodies.
- Question
- Answer
Do we use a direct glucose sensor to release insulin?
No, glucose concentration is measured indirectly by its capacity to generate ATP in beta cells.
- Glucose is detected in beta cells of the pancreas through its metabolic ATP production. Glucose-stimulated insulin secretion is proportional to the glucose concentration above a threshold of 5.5 mM.
- Fat metabolism can be induced through binding of fatty acids to peroxisome proliferator activated receptors (PPAR). These bind to regulatory regions of many genes involved in lipid metabolism.
- Proteins are extensively recycled through a pool of cellular amino acids. The pool is tightly regulated by protein kinases mTORC1 and GCN2, which regulate protein translation, degradation, amino acid synthesis and transport.
- Energy is sensed through metabolic coupling, protein kinase AMPK and protein deacetylating sirtuins.
- Even when fasting or starving, energy and glucose levels can be maintained for many weeks, by coordinated metabolic programs such as gluconeogenesis, lipolysis and ketogenesis.
- Fig. 1 By the author using ChemDraw
- Fig. 2 By the author using Powerpoint
- Fig. 3 By the author using Powerpoint and using Image OpenStax College [CC BY-SA 3.0 (https://creativecommons.org/licenses/by-sa/3.0)], via Wikimedia Commons
- Fig. 4 By the author using ChemDraw
- Fig. 5 By the author using ChemDraw
- Fig. 6 The original uploader was Bigplankton at English Wikipedia.Later versions were uploaded by Sunholm at en.wikipedia. [Public domain], via Wikimedia Commons
- Fig. 7 By the author using Powerpoint
- Fig. 8 By the author using ChemDraw
- Fig. 9 By the author using ChemDraw
- Fig. 10 By the author using ChemDraw
- Fig. 11 By the author using ChemDraw
- Fig. 12 University of Delaware
- Fig. 13 By the author using Biorender
- Fig. 14 By the author using Graphpad Prism
- Fig. 16 By the author using ChemDraw
- Fig. 16 By the author using Powerpoint