Have a look at the two different types of meet. One is from chicken the other from horse. Which one is which? Why is the colour different? How will these muscles be used?
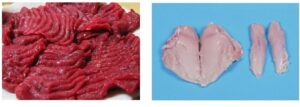
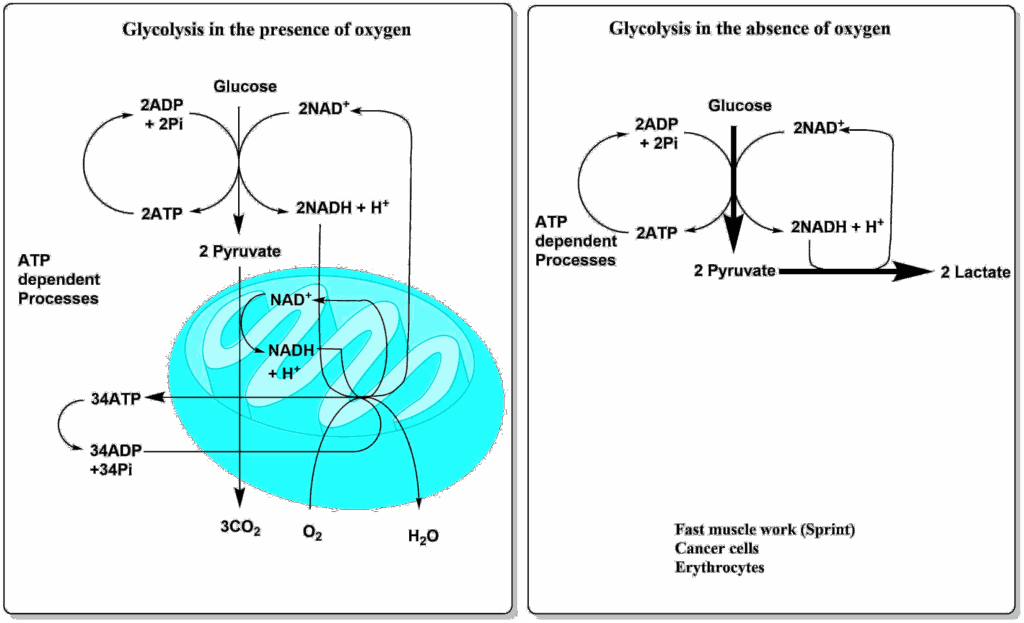
Horse meet is dark, because horses run for extended period of times and will require oxidative metabolism to generate ATP. Chicken only fly short distances, for instance to escape onto a tree. ATP production by glycolysis is sufficient. The colour is generated by mitochondria, which are essential for oxidative metabolism and myoglobin, which stores oxygen.

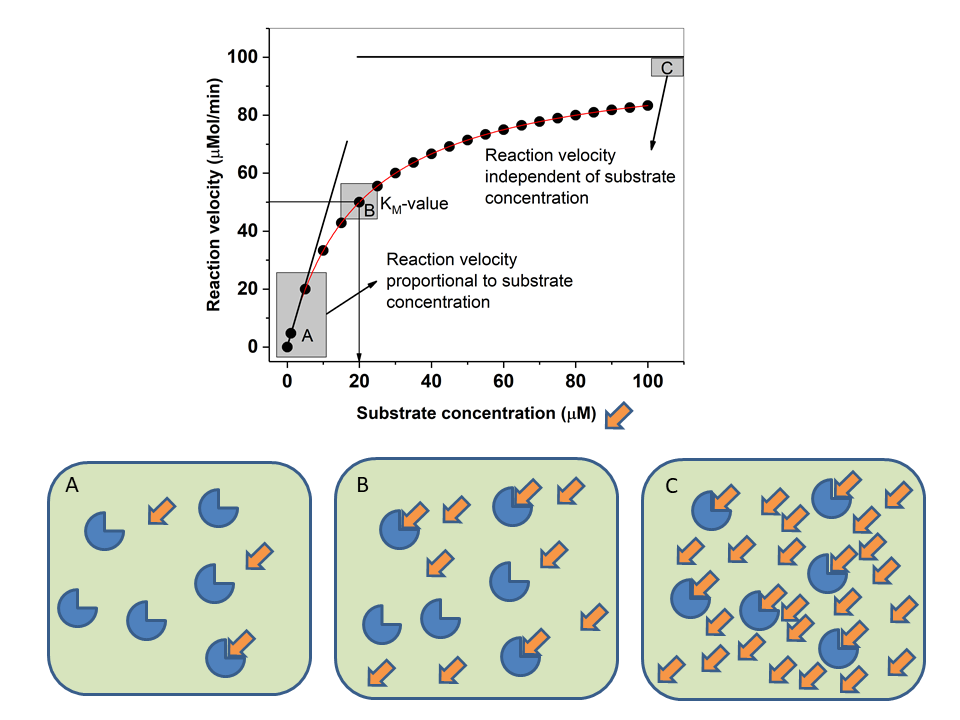
In chapter 5 you learned that enzymes bind tightly to the transition state of the substrate and through interactions between enzyme and substrate a chemical reaction is facilitated, which would hardly occur without the enzyme. The binding of a substrate to an enzyme and its conversion to a product has been analysed mathematically by Leonard Michaelis and Maude Menten. When we formalise an enzymatic reaction we can state:
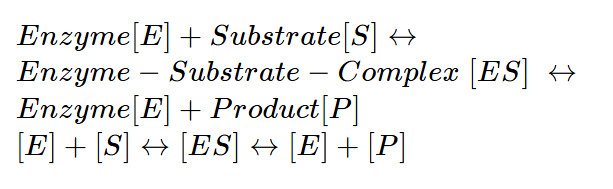
The changes to substrate, enzyme, enzyme-substrate complex and product can be formulated as rate equations and solved mathematically. If you are interested in the derivation of the equation you can watch this video.
To solve the equation, a couple of simplifications are made that can be easily achieved in laboratory experiments.
- The enzyme rate will be determined in the presence of substrate and enzyme, but hardly any product. This prevents the reversal of the reaction.
- Substrate is in excess of enzyme and the substrate concentration will essentially remain unchanged during the experiment.
- Steady state conditions are maintained, substrate is turned over into product at a steady rate.
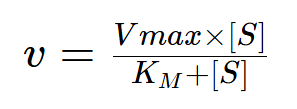
Under these conditions the reaction velocity (v) has a hyperbolic relationship to the substrate concentration, described by the Michaelis-Menten equation.
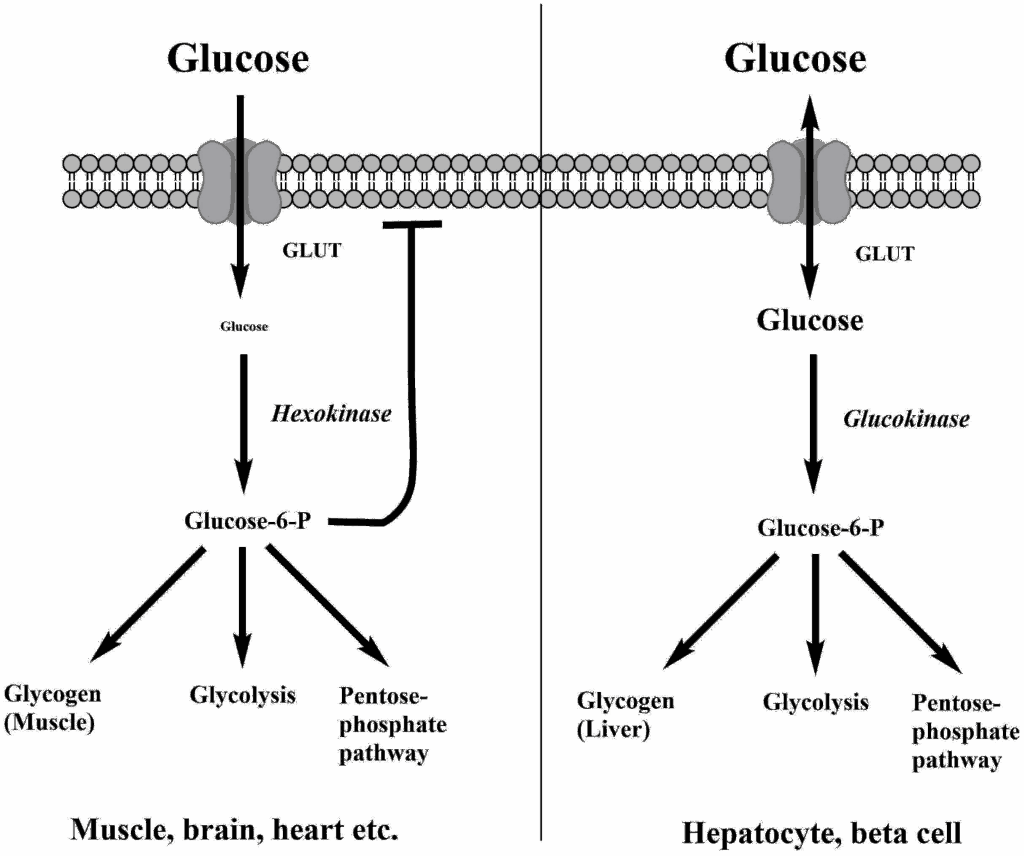
We learned earlier that hexokinase is used in tissues that need glucose for energy production, while glucokinase – which catalyses the same reaction – is used in cells that sense glucose. Inspect the kinetic properties and draw your conclusion? Does the kinetic behaviour make sense?
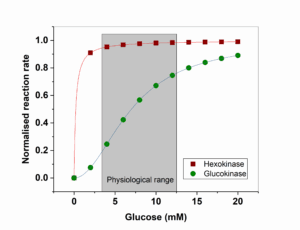
Hexokinase reaches Vmax even at low physiological glucose concentrations (<4mM). Glukokinase has 50% activity in the physiological range. Small changes of the glucose concentration will change the velocity of glycolysis.