8 Gluconeogenesis and Glycogen
- Understand how glucose is generated during fasting.
- Appreciate the tight control of blood glucose levels
- Understand the reversible storage of carbohydrates as glycogen
- Glucose homeostasis
- Gluconeogenesis and its precursors
- Principles of signal transduction pathways
- Reciprocal regulation of opposing metabolic pathways
Our cells need energy continuously, yet we eat only every couple of hours or can sleep for 8h without running out of ATP. How is that possible?
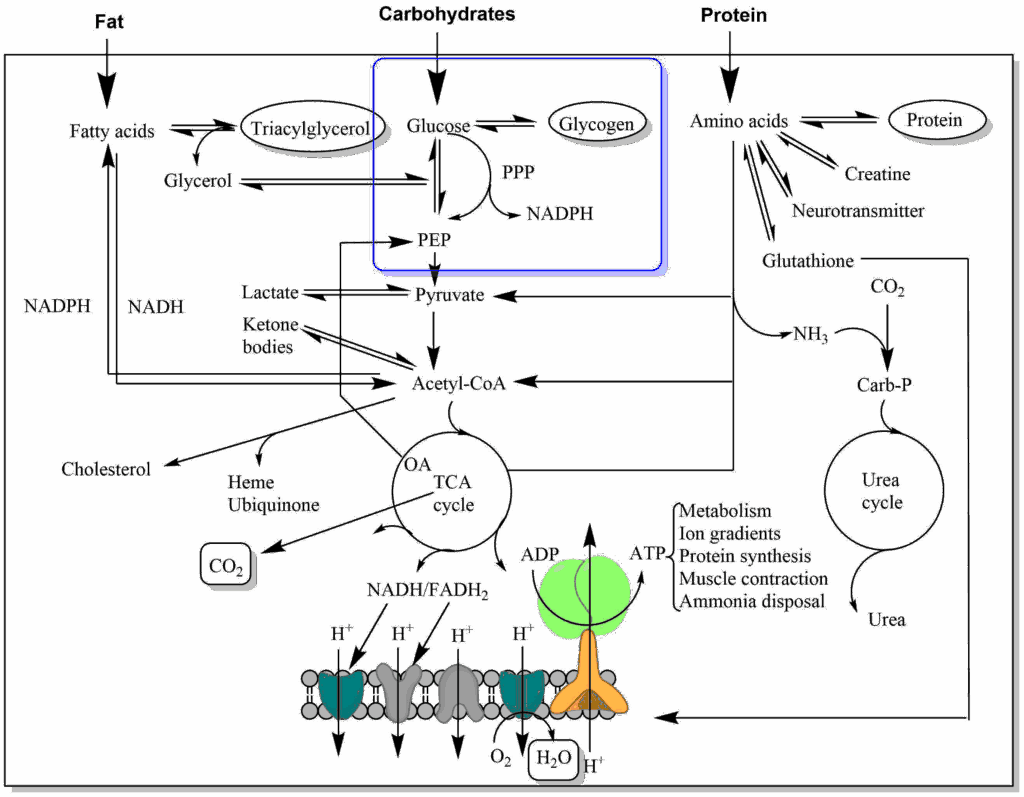
Food intake can only increase glucose levels. Glycogen reversibly stores glucose and thus can decrease or increase glucose levels. Glycolysis degrades glucose, while gluconeogenesis generates glucose. Acetyl-CoA generated from glucose can be fully oxidised or converted into fat. Of the fat molecule (triacylglycerol), only the glycerol backbone can be converted back to glucose. The fatty acids are broken down to yield acetyl-CoA, which through the TCA cycle can only generate CO2. We will first have a look at gluconeogenesis and see how it maintains glucose levels overnight. The question arises: can we synthesise glucose simply by reversal of glycolysis? Inspect the table below, which lists all steps of glycolysis and their free energy, to find the answer.
| Reaction step | deltaG0' (standard, kJ/mol) | deltaG (cellular, kJ/mol) |
|---|---|---|
|
Glc+ATP –> Glc-6P+ADP |
-16.7 |
-33.4 |
|
Glc-6P –> Fru-6P |
1.7 |
0 kJ/mol |
|
Fru-6P+ATP–>Fru1,6BP+ADP |
-14.2 |
-22.2 |
|
Fru1,6BP–>DHAP+GA3P |
+23.8 |
0 kJ/mol |
|
DHAP–>GA3P |
7.5 |
0 kJ/mol |
|
GA3P+P+NAD–>1,3BPG+NADH |
+6.3 |
0 kJ/mol |
|
1,3BPG+ADP–>3PG+ATP |
-18.8 |
0 kJ/mol |
|
3PG–>2PG |
+4.4 |
0 kJ/mol |
|
PEP+ADP–>Pyruvate+ATP |
-31.4 |
-16.7 |
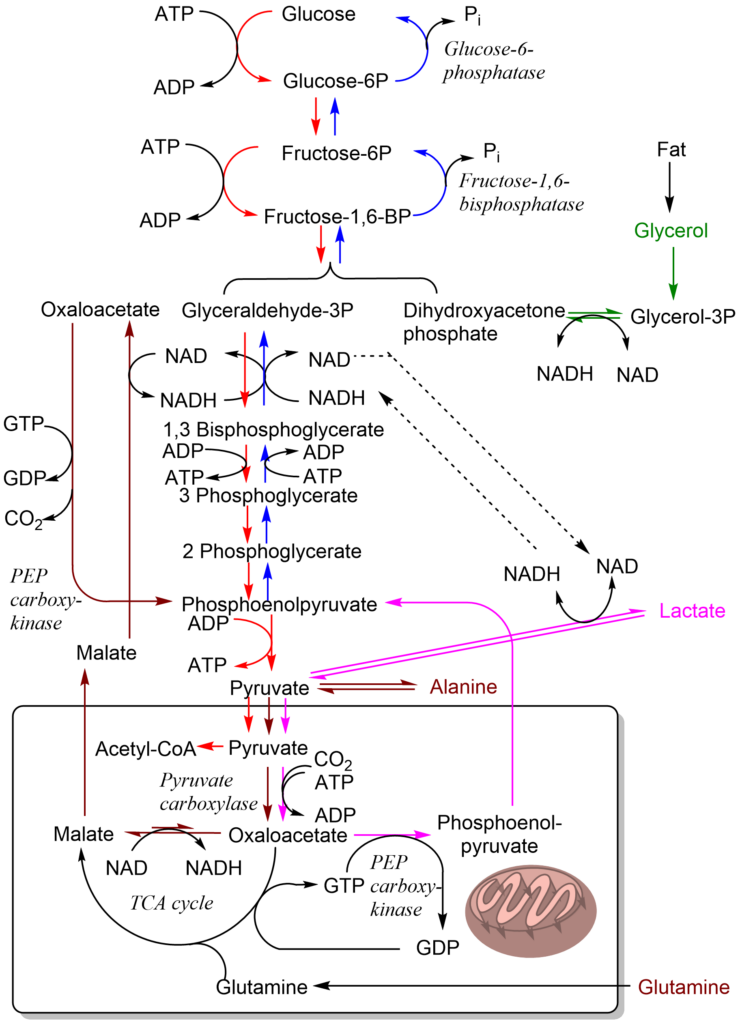
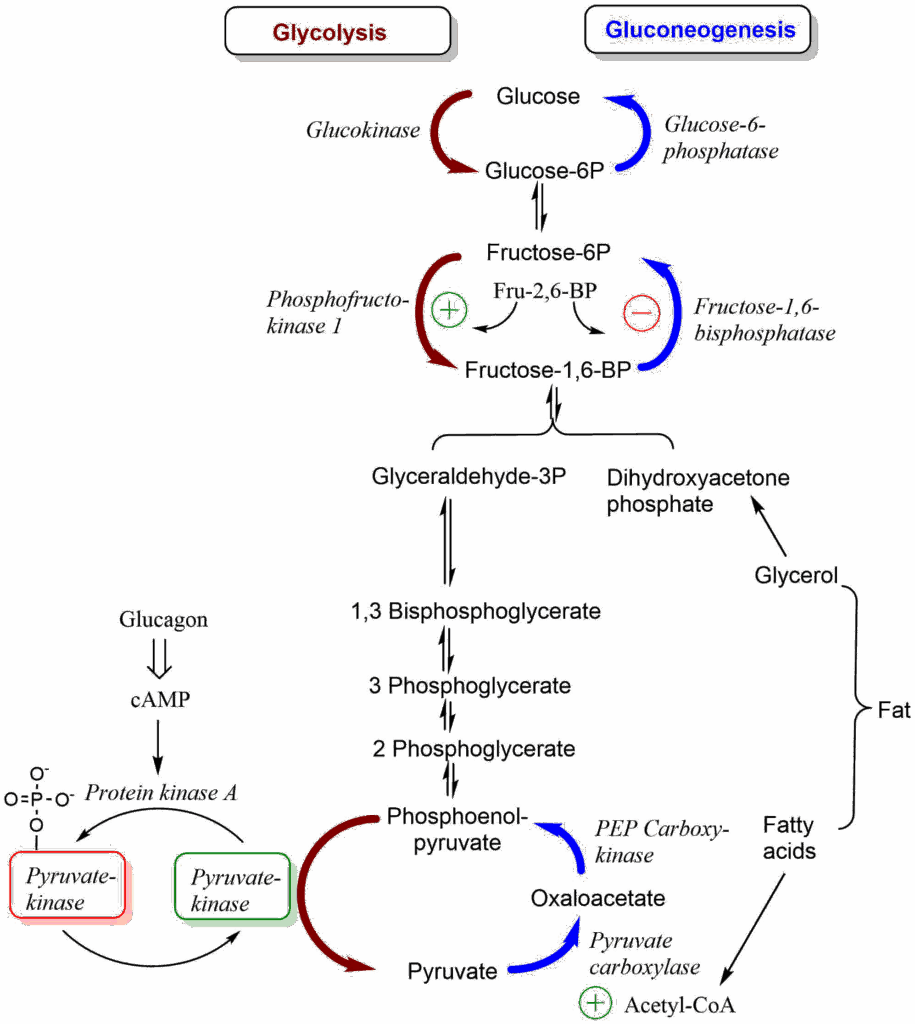
In glycolysis all but three steps are readily reversible. To synthesize glucose we need to find alternatives for the reactions that have a large negative free energy. This is straightforward for the hexokinase and phosphofructokinase reaction, which in the forward reaction (glycolysis) use ATP: Instead of synthesising ATP in the reverse reaction (gluconeogenesis), our cells just hydrolyse the phosphate, which is energetically favorable (Fig. 3). This alternative is not available for the pyruvate kinase reaction, because its reversal would consume ATP. Thus, we need a detour (Fig. 3).

Regulation of biochemical processes is generally referred to as signal transduction, because they are typically initiated by signals, such as hormones, neurotransmitters, mechanical stimuli etc. Before we look into details we need to understand an important principle of biological regulation. Biochemical pathways rarely stop and go, they rather slow down or accelerate. This is even true for opposite pathways such as glycolysis/gluconeogensis, fat synthesis/breakdown, protein synthesis/breakdown. To make an analogy, think of biological regulation as pushing the brake and accelerator pedal at the same time.
Increasing the speed is done by releasing the brake slightly and pushing down the accelerator slightly more. Decreasing the speed is done in the opposite way. It is important to incorporate this concept of steady state into biochemical thinking. For example, glycolysis would indeed stop when no ATP is needed (after death), however, there is always demand for ATP, sometimes more sometimes less. Steady state theory is tightly linked to metabolic coupling, which we have come across many times.
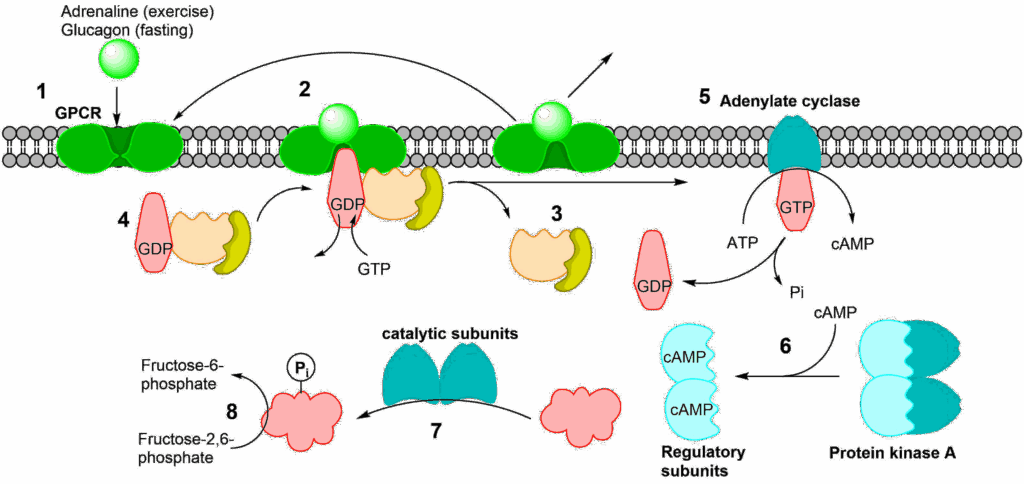
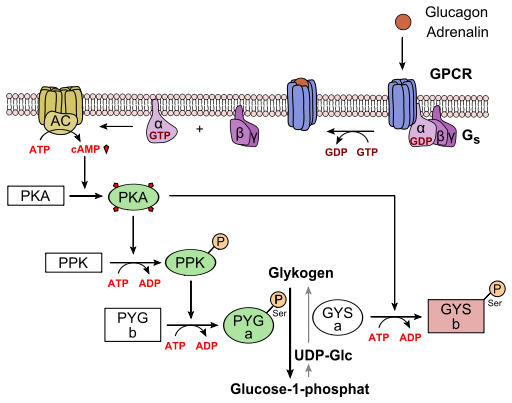
Fig. 7 shows the sequence of events. (1) Glucagon (the first messenger) binds to its receptor at the cell surface. This particular class of receptor is called a G-protein coupled receptor (GPCR). The term G-protein refers to a group of proteins that can bind GDP or GTP and are regulated by these nucleotides. In their inactive form GDP is found in the binding site. When GTP is in the binding site they are active, but GTP is slowly hydrolysed to GDP. After binding of glucagon a conformational change occurs in the receptor, opening a binding site for a G-protein on the cytosolic side. When the G-protein binds to the receptor, GDP is released and exchanged for a GTP molecule (2). This causes the heterotrimeric G-protein complex to fall apart (3). The complex will reform once GTP in the alpha unit has been hydrolysed to GDP (4), thereby resetting the whole system. The hydrolysis is slow to allow the signal to last for a while. The alpha unit, which binds the GTP is now activated and can interact with other proteins, most notably adenylate cyclase (5). Adenylate cyclase is activated by this process and catalyses the conversion of ATP to cyclic-AMP (cAMP, the second messenger); cAMP in turn activates protein kinase A (6). The activation is caused by cAMP binding to the regulatory subunits, which then dissociate from the catalytic subunits (7). The liberated catalytic subunits can now phosphorylate the final target, the bifunctional enzyme fructose-2,6-bisphosphatase/phosphofructokinase 2 (8). Before we look at this enzyme watch the video below.
The colour coding of the subunits is the same as in Fig. 7. Can you identify steps 1-6 (7,8 not in the video)?
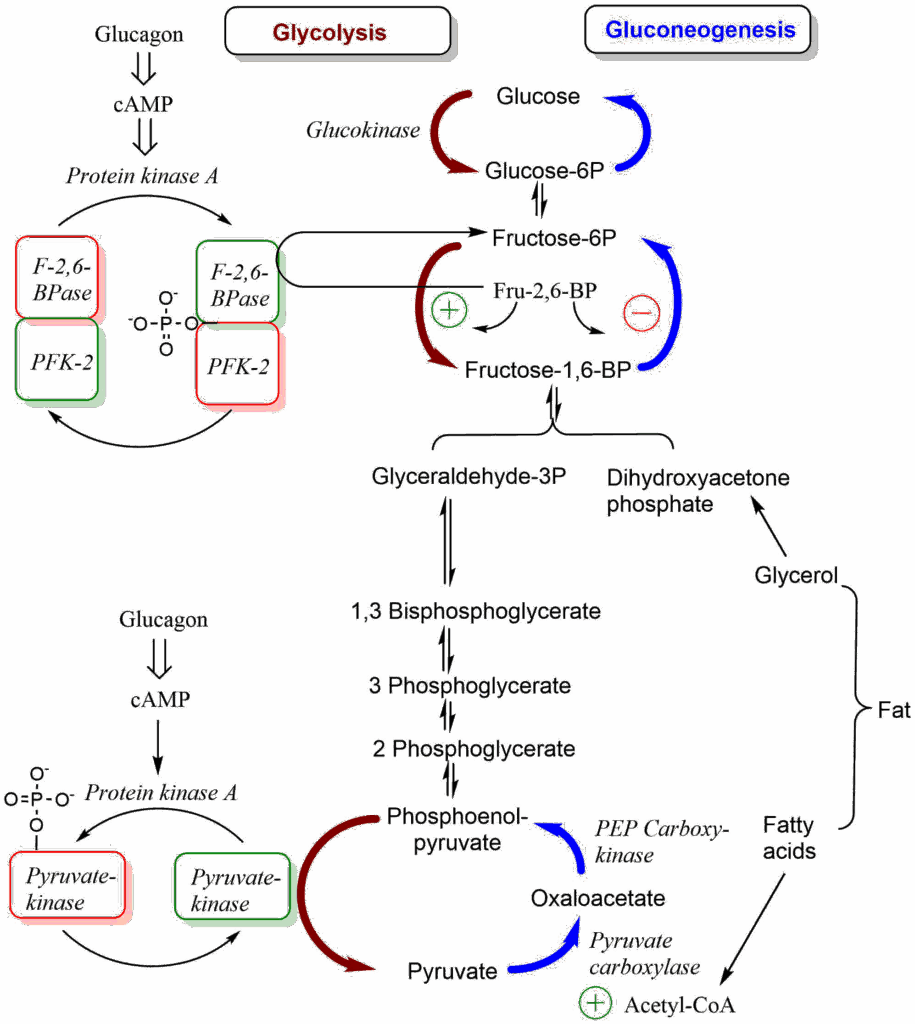
Fructose-2,6-bisphosphatase/phosphofructokinase 2 has two catalytic activities. It can convert the glycolytic intermediate fructose-6-phosphate into the allosteric regulator fructose-2,6-bisphosphate or breakdown fructose-2,6-bisphosphate to reform fructose-6-phosphate. Having both parts active at the same time would make no sense, thus one activity dominates while the other is blocked. To understand what the bifunctional enzyme fructose-2,6-bisphosphatase/phosphofructokinase 2 does, we need to look again at the regulation of glycolysis/gluconeogensis (Fig. 8).
Question about blood glucose
Assume you had a slice of pizza for lunch. What would be your blood glucose concentration if your body would digest the carbohydrates in the pizza to glucose and absorb it completely within 2h (this is a good approximation of what happens), but could not store or metabolise any of the glucose. A slice of pizza contains 30g of carbohydrates and the molecular weight of a glucose unit in starch is 162g/mol. Assume a blood volume of 5L. Give your answer in mMol/L without the unit and round to the next full number. Compare this to Fig. 1.
Blood glucose
37 mmol/L
The answer to the question suggests that a large fraction of glucose is stored directly after a meal and released later on. This storage buffer of glucose is glycogen which is synthesized after a meal and broken down between meals. We will discuss this now in more detail.
Glycogen
Glycogen is a branched polymer of glucose attached to the protein glycogenin (Fig. 9). Glycogen particles can be seen in electron micrographs of the cytosol. Figure 9 also shows the loading/use of glycogen in mice during a light/dark cycle. In the dark (black line) mice consume food loading glycogen, while during light (open line) they are active, but do not feed, depleting glycogen stores within 6h.
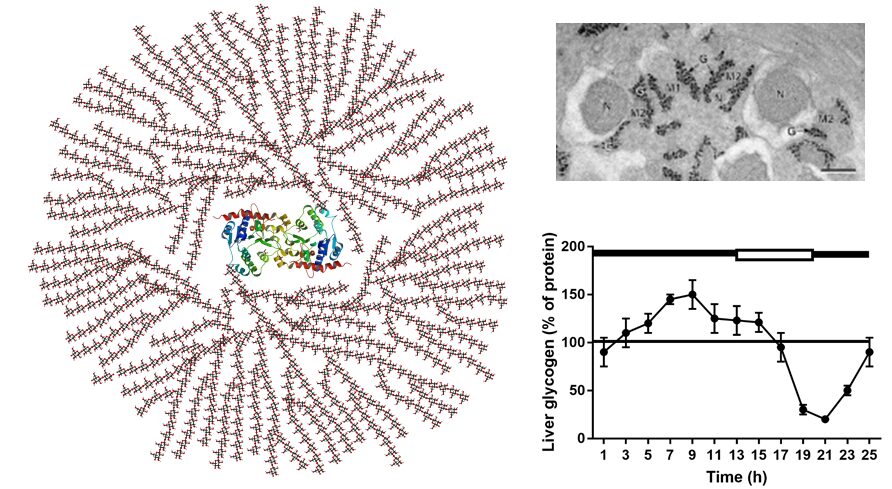
Also in humans glycogen is the main source of glucose during the early hours of fasting (see Table). Overnight gluconeogenesis becomes more dominant.
| Length of fast (h) | Liver glycogen content (umol/g liver) | Rate of glycogenolysis (umol/kg * min) |
|---|---|---|
|
0h |
300 |
0 umol/kg*min |
|
2 |
260 |
4.3 |
|
4 |
216 |
4.3 |
|
24 |
42 |
1.7 |
|
64 |
16 |
0.3 |
How does glycogen build-up and degradation work? There are two key enzymes, which regulate the process, namely glycogen synthase and glycogen phosphorylase (Fig. 10).
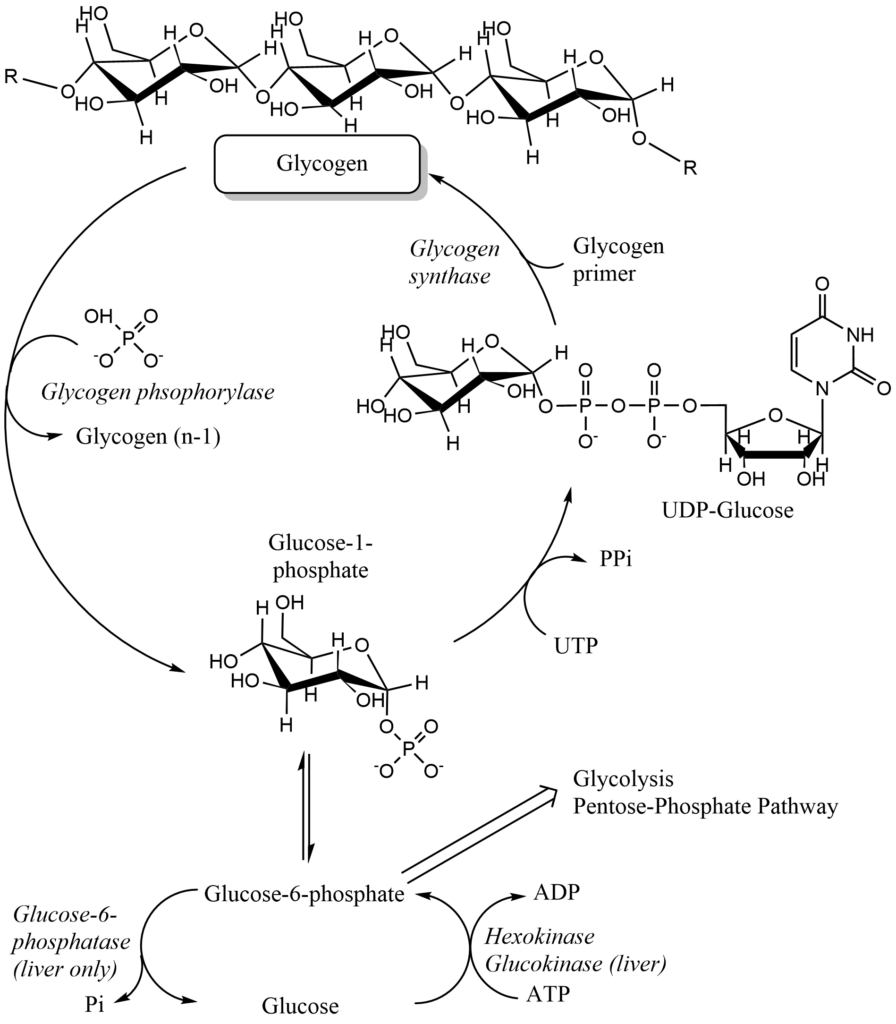
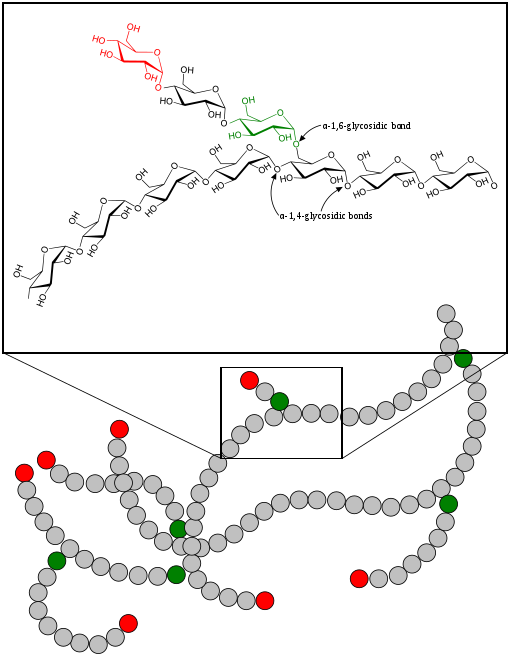
Glycogen synthesis cannot proceed spontaneously, because water has to be eliminated in the reaction, which is energetically unfavorable. Therefore, a chemically activated form of glucose, namely UDP-glucose is used. Similar to coenzyme A, which is used to chemically activate fatty acids, nucleotides are used to activate sugars, typically UTP or CTP. In a reaction where pyrophosphate (PPi) is released from UTP a nucleotide-monophosphate is linked to glucose-1-phosphate forming UDP-glucose. This reaction is driven by the subsequent hydrolysis of pyrophosphate into 2 molecules of phosphate. While glycogen synthesis with glucose-1-phosphate is not energetically favorable, it is when UDP-glucose is used instead. There is also a branching and debranching enzyme involved to build up and break down glycogen (Fig. 11), but we do not discuss these reactions here. Final glycogen particles grow until 12 tiers have been formed, each with 12-14 glucose residues and two branches. As a result, there are about 55,000 glucose molecules in a glycogen particle. The branched nature of glycogen is important though to ensure rapid parallel breakdown at many sites.
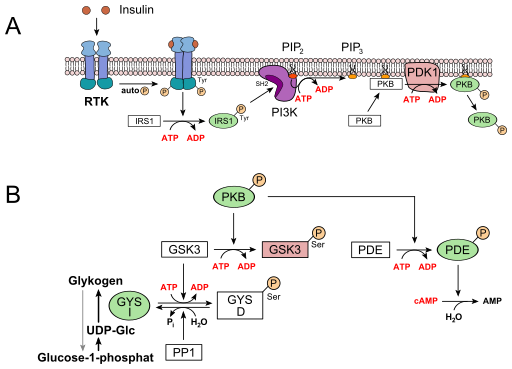
The regulation of glycogen synthase by insulin is fairly complex but follows the same principles of signal transduction as discussed above. Insulin is the first messenger and binds to its receptor (Receptor tyrosine kinase, RTK). This brings the two halves of the receptor together and they cross-phosphorylate (called autophosphorylation) each other on tyrosine residues. The phosphorylated receptor is recognised by the insulin receptor substrate 1 (IRS-1), which in turn becomes phosphorylated itself. The phosphorylated IRS-1 docks onto phosphatidylinositol-3-kinase (PI3K) and activates it. Instead of a water soluble second messenger, such as cAMP, a specific membrane-bound lipid is generated as second messenger, namely phosphatidylinositol-triphosphate (PIP3). It is made by phosphorylation of phosphatidylinositol-diphosphate (PIP2), one of the minor components of the membrane bilayer. PIP3 in turn activates phospholipid dependent kinase (PDK1), which phosphorylates and activates protein kinase B (PKB). Active PKB-Pi, phosphorylates its target glycogen synthase kinase 3 (GSK3), thereby inactivating it. Active GSK3 would normally phosphorylate glycogen synthase (GYS), inactivating it, as well. Thus inactivating GSK3, allows protein phosphatase 1 (PP1), to dephosphorylate glycogen synthase and thereby activating it. Active PKB-Pi has other targets as well, particularly phosphodiesterase (PDE), which becomes active when phosphorylated and hydrolyses cAMP to AMP. This is a safety mechanism to avoid another futile cycle, namely synthesis and breakdown of glycogen at the same time. This is a perfect segue way to look at the regulation of glycogen breakdown (Fig. 14).
Sources of glucose
Fasting and Fasting + 20 min Exercise
No Data Found
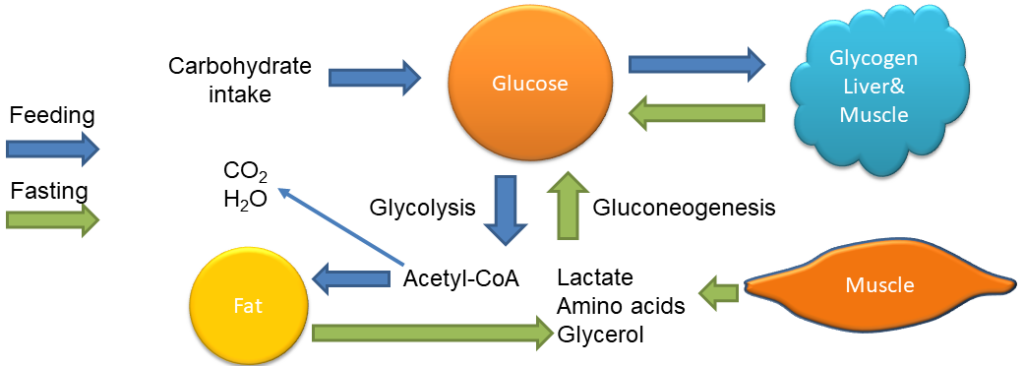
During fasting glycogen, and gluconeoegensis from glycerol (from fat) and lactate are the main sources of glucose. Amino acids make a smaller contribution. There is a notable jump in the use of glycogen and lactate during 20 min of exercise.
Another question is which source maintains glucose overnight. See Fig. 16.
Sources of glucose
No Data Found
In the first 4h after a meal glucose is provided by the food that was consumed. The digestion process takes its time, and a large flow of glucose occurs, which is higher than the actual needs. Once the food is digested and glucose deposited (4h) glycogen is used to maintain blood glucose. After 8h of fasting gluconeogenesis starts and becomes the dominant source beyond 16h of fasting. Glycogen runs out after 24h.
Which steps of glycolysis are difficult to reverse? How does this affect gluconeogenesis?
There are 3 reactions in glycolysis with a large negative free energy, namely hexokinase, phosphofructokinase and pyruvate kinase. These steps are different in gluconeogenesis.
Why is it important that the mechanisms that activate glycogen synthesis also deactivate glycogen phosphorylase?
To reduce futile cycling between glycogen synthesis and breakdown. However, we have seen that concurrent activity of opposing pathways is an important aspect of metabolic regulation.
The concentration of lactate in blood rises sharply during brief high-intensity exercise and declines slowly for about an hour afterward. What causes the rapid rise of lactate? What causes the decline?
The rise is caused by anaerobic glycolysis, during which NAD+ is recycled by conversion of pyruvate to lactate. When exercise is over lactate is removed by gluconeogenesis through the liver.
Why is it advantageous to have two control mechanisms – allosteric regulation and covalent modification – to be involved in metabolic regulation?
Allosteric control is instantly available, while covalent modification such as phosphorylation is slower but can be used to initiate specific metabolic programs.
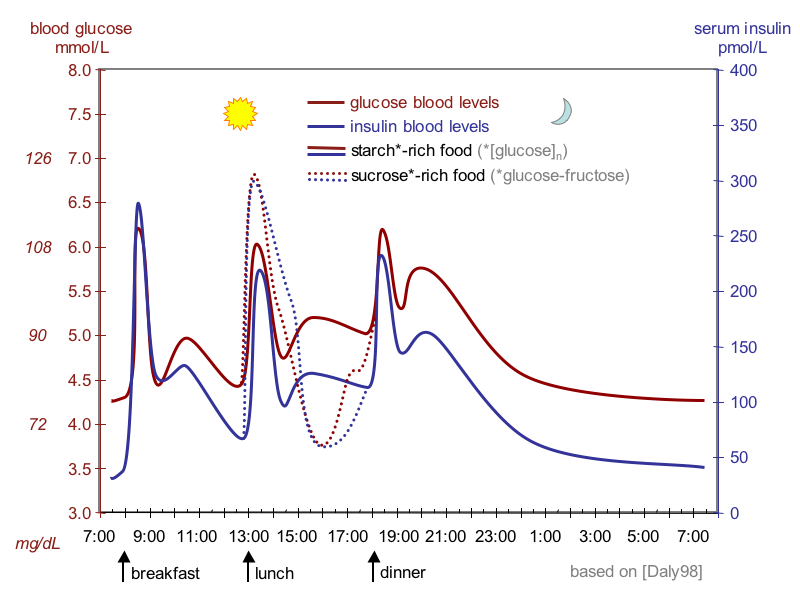
Why does a sucrose-rich meal generate a higher glucose spike than a starch-rich meal (Fig. 1)
Sucrose is easy to digest only requiring a brush-border enzyme to split it into glucose and fructose (Chapter 5). Thus, glucose is readily available.
- Glucose levels are maintained by the body at around 4-5 mM over long periods mainly to fuel the brain
- In the absence of carbohydrates this is ensured by gluconeogenesis
- Glycerol, amino acids and lactate are the main precursors for gluconeogenesis
- Short term maintenance of blood glucose is controlled by synthesis and breakdown of glycogen
- Glycogen synthesis makes use of UDP-conjugated glucose breakdown is mediated by phosphorolysis rather than hydrolysis
- The liver is the main site for glucose homeostasis
- Signal transduction makes use of (first) messengers (hormones, neurotransmitters) that are released from cells after receiving a stimulus.
- The first messenger binds to receptors that can be located on the surface of cells or inside the cell.
- Binding to a receptor will initiate a signal transduction cascade.
- Protein-phosphorylation and conformational changes are most commonly used to propagate signals.
- Phosphorylation can activate or inactivate proteins.
- Signal transduction inside cells involves second messengers. These can be phospholipids that become more phosphorylated and attract proteins to the membrane or soluble second messengers such as cyclic-AMP or cyclic-GMP.
- Second messengers can activate protein kinases, which phosphorylate other proteins.
- Target proteins are often enzymes or transcription factors
- Fig. 1 Mcstrother [CC BY-SA 3.0 (https://creativecommons.org/licenses/by-sa/3.0)], from Wikimedia Commons
- Fig. 2 By the author using Powerpoint
- Fig. 3 By the author using ChemDraw
- Fig. 4 By the author using ChemDraw
- Fig. 5 Michael Sheehan [CC BY 2.0 (https://creativecommons.org/licenses/by/2.0)], via Wikimedia Commons
- Fig. 6 By the author using Powerpoint
- Fig. 7 By the author using ChemDraw
- Fig. 8 By the author using ChemDraw
- Fig. 9 A, B, C; A: By Mikael Häggström, used with permission. [Public domain], via Wikimedia Commons; B: Jordi Miquel, Daniel Vilavella, Zdzisław Świderski, Vladimir V. Shimalov and Jordi Torres [CC BY 4.0 (https://creativecommons.org/licenses/by/4.0)], via Wikimedia Commons ; C: By the author: Drawn after data from: Weinert D, Freyberg S, Touitou Y, Djeridane Y, Waterhouse JM. The phasing of circadian rhythms in mice kept under normal or short photoperiods. Physiol Behav. 2005 Apr 13;84(5):791-8. Epub 2005 Apr 12. PubMed PMID: 15885257.
- Fig. 10 By the author using ChemDraw
- Fig. 11 GKFXtalk 12:08, 5 September 2017 (UTC) [Public domain], via Wikimedia Commons
- Fig. 12 Yikrazuul [CC BY-SA 3.0 (https://creativecommons.org/licenses/by-sa/3.0)], from Wikimedia Commons
- Fig. 13 Yikrazuul [CC BY-SA 3.0 (https://creativecommons.org/licenses/by-sa/3.0)], from Wikimedia Commons
- Fig. 14 Yikrazuul [CC BY-SA 3.0 (https://creativecommons.org/licenses/by-sa/3.0)], via Wikimedia Commons
- By the author using data from Jessie et al. Cell Metabolism, Vol. 36, 2560-2579
- By the author after Cahill, Ann. Rev. Nutr. 26:1-22, 2006
.jpg)